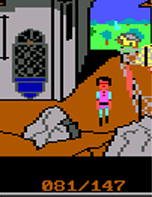
The obvious starting point is to look around code that's for the room you're in before the game crashes. Try and identify conditions that triggers the error. These would include: touching a line, sound finished, changing rooms, etc, etc. Once you know this, it will help you identify where to use the debugging tools.
 |
| Tracing lets you step through each command individually. |
Initialising Trace: In the interpreter's "natural state", it doesn't have tracing on by default. You have to perform a few functions
first to initialise it. Most game have debug code to do this. The standard way is to press "alt-d", usually this will set the trace
flag for you. The commands vary from game to game though. If you're adding it to your own game, the commands are:
set.flag(10);Flag 10 is the trace flag, it has to be set to enable tracing. "trace.info" does the initialising of the trace data. The logic number points to a special logic that has all the names of the commands as messages. The "pos" is the line number of the top of the trace window whilst "height" is the height of the trace window.
trace.info(logic number, pos, height);
Calling Trace: There are two ways to open the trace window after you have initialised it with code or by the alt-d/"trace on" commands.
Trace Commands: There are three basic commands whilst in the trace window.
Closing Trace Window: After you are finished with trace, you can close the window off by pressing "scroll-lock".
| "show.mem" will help you tune the memory usage of your game. |
 |
| Object Status lets you quickly see what your animated object is up to. |
Logging: Logging is great if you want feedback from the users of your game. You can use it to log anything. Most of the developers from Sierra used it to log words that users typed in but the interpreter didn't understand. It was this was that they managed to beef up their dictionaries. You could use it to log whole phrases, places in the screen that the user visits, the score at certain points in the game (to see if they're missing anything)... etc etc. For beta versions of your game, this would be great to incorporate if you want more feedback. You could even have a flag that's set to remind the users when they quit, if they logged anything, to email it back to you.
The syntax for the log function is simple:
log(<message>);The format of the log is this:
"Note the two extra lines at the start of each entry. The message that you specify is wrapped so it will fit in an 80 character wide text file.Room <room number>
Input line: <last input line>
<your message here>"
 |
| Having a constant display of the ego's position was common in Sierra's debug mode. |
The best way to display something is to use this code:
display(24, 0, "my variable = %v50 ");It's suggested you use a few spaces after the string, because if the value of the variable changes from one digit to two, you won't get hanging characters.
Special Debug Code: In Kings Quest 3, they have an entire debug logic section dedicated to the wizard because he is such a complicated beast. You can track where he is, what he's doing, what he's waiting for you to do and how long he's going to be. You could do the same thing for you game if you wanted to debug some complicated code. Write code that would be run side by side, to give the state of the code that you're trying to debug.
Another technique is just to add to the generic debug logic code that all games have. This includes all those "show var" and "tp" commands that most AGI debug modes have. You could develop more debug commands off that.
Vary the Interpreter: A different strategy to try is to run the game under different versions of the interpreter or one of the fanmade interpreters. The reason for this is because of the different ways they can handle the data. NAGI has a few workarounds for bugs and so would Sarien and AGIL. One bug that crashes the Sierra interpreter might not crash NAGI or Sarien. The idea is to see the effects of what the bug does so, if game still runs with the ego running around as a spaceship, you might want to look at any code that changes the ego's view resource.
Top
You can help keep The Sierra Help Pages and its affiliates alive by helping to defray some of the costs of hosting this site. If it has been of help to you, please consider contributing to help keep it online.Thank you.
The Sierra Help Pages | Sierra Game Help | Walkthroughs | Hints, Tips & Spoilers | Utilities | Links | SHP Forums | Search
© 2013 to present The Sierra Help Pages. All rights reserved. All Sierra games, artwork and music © Sierra.